For reasons of data availability, inequality is commonly studied in terms of household income as opposed to individual income. Although the European Union Statistics on Income and Living Conditions (EU-SILC) dataset provides comparative data on incomes and living conditions for the EU from 2005 to 2013, caution should be exercised when making comparisons across countries or over time.[1] Although the EU-SILC has made a huge effort to gather and homogenise data from different sources and EU countries, if the aim is to analyse territorial disparities across the EU, then we face a serious limitation: the basic spatial unit of analysis is NUTS2 regions.
NUTS 2 regions usually comprise large areas with pronounced internal heterogeneity in terms of income and many other socio-economic indicators. In Spain, NUTS2 regions correspond to Autonomous Communities. When calculating the Theil index and its components for the Spanish NUTS 2 regions, we find that 95.82% of the territorial inequalities observed in household income correspond to disparities within the regions[2].
How can territorial inequalities within the regions be analysed without data on household income beyond NUTS2 regions? Aware of the importance of this limitation, the European Union launched the IMAJINE Project (https://imajine-project.eu) within the framework of Horizon 2020, with the participation of 16 research centres from 13 EU countries. The University of Oviedo is one of the partners of the project, leading WP2 (Analysis of Territorial Inequalities in Europe) and contributing to WP3 (Economic Growth, Territorial Cohesion and Regional Autonomy). One of the main objectives of WP2 is to estimate data at local level from regional aggregates (when local values do not exist) and to collect socio-economic indicators at local level.
Using an econometric methodology based on entropy techniques[3] to disaggregate official regional household income data into smaller spatial units, the IMAJINE Project provides household income figures at local level. The statistical resources necessary to implement the methodology only permit us to obtain estimations for year 2011, which is the year of the last Population and Housing Census available for many EU countries.
In the following maps we represent 2011 average household income for the Spanish NUTS 2 regions (Map 1) and the estimates obtained in the IMAJINE Project for the 8,124 Spanish municipalities (LAU2 level) (Map 2)
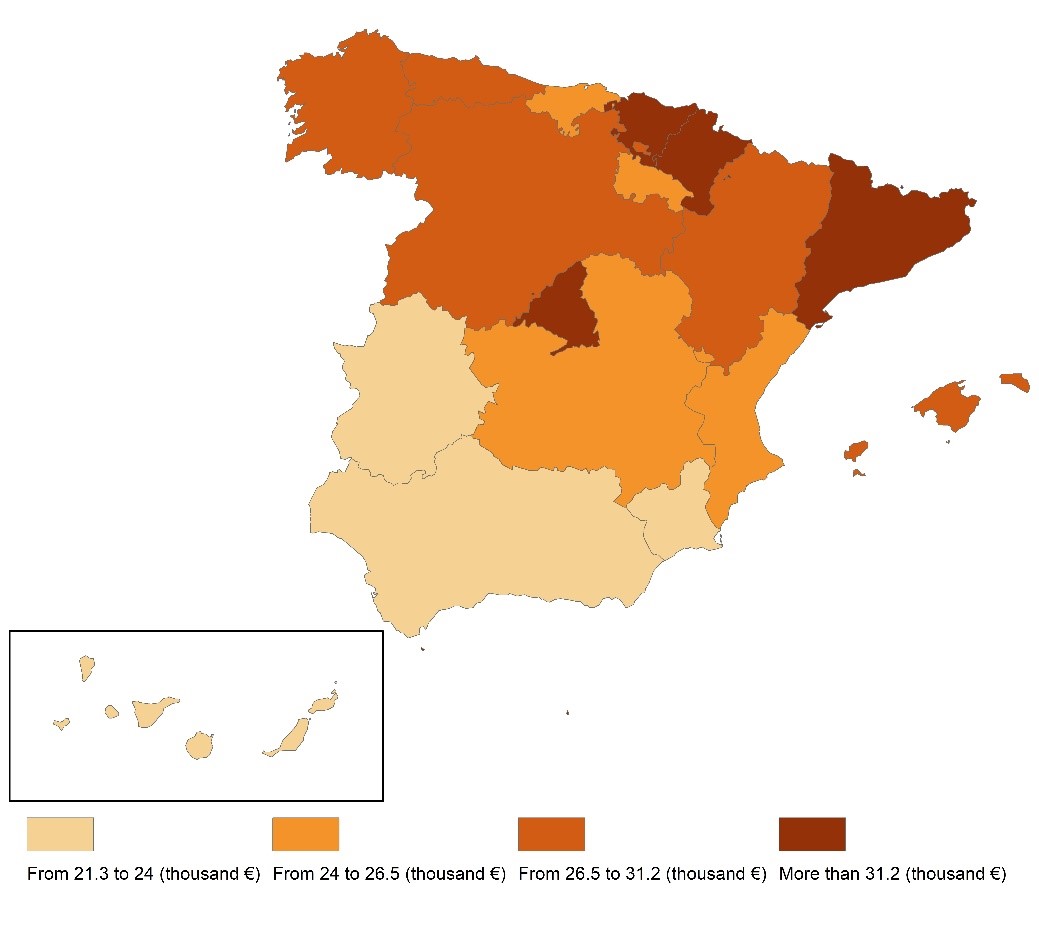 Map 1. Average household income. Spanish NUTS2 regions or Autonomous Communities (2011)
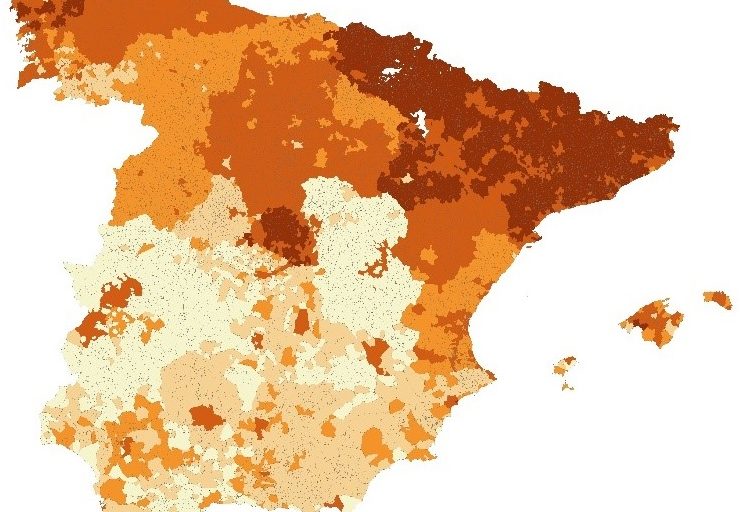
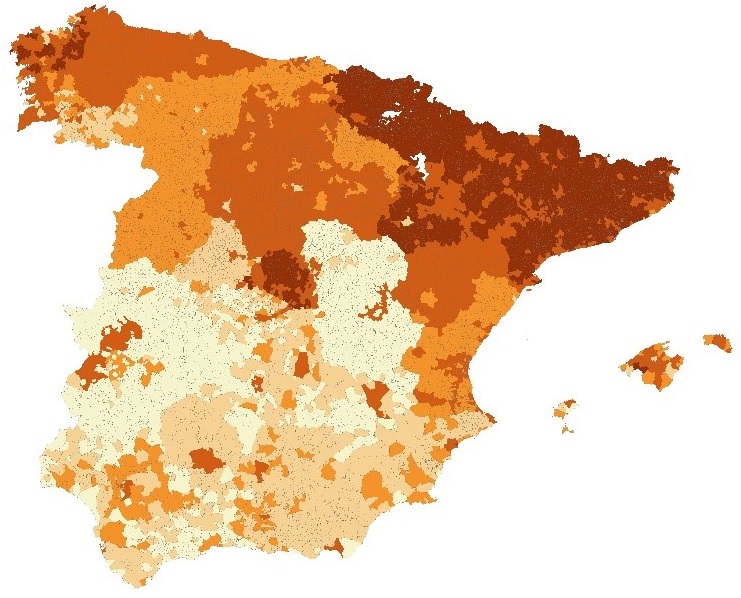 Map 2. Average household income. Spanish LAU2 or municipalities (2011)
At NUTS2 level we observed a well-known pattern: regions located in the North and Northeast of the Spanish territory, plus Madrid in the center of the country, have the higher levels of household income, while the South of the country (in broad terms) shows income levels 30-35% lower than the richer regions. However, when descending at a lower spatial level we can observe huge territorial disparities within regions, with high-income municipalities in “poor” regions (usually those municipalities corresponding to cities) and low-income municipalities around large metropolitan areas such as Madrid and Barcelona belonging to “rich” regions.
Ana Viñuela, Fernando Rubiera & Esteban Fernandez (University of Oviedo)
[1] Differences can originate from, among others, the definition of a household, the definition of income, the inclusion of rental income, the inclusion benefits from employers or the use of estimated figures in some countries.
[2] See D2.4 of the IMAJINE Project for details
[3] See D2.2 of the IMAJINE Project for details