
Recent media reports have highlighted inequalities in the impacts of the global COVID-19 outbreak, emphasizing increasing concerns that both the virus and measures introduced to control its spread are hitting poorer people and areas the hardest. In the Horizon 2020 IMAJINE project, we have been exploring the dynamics of territorial inequalities in Europe and investigating how these can be most effectively addressed by policy interventions, drawing in particular on the concept of spatial justice. The COVID-19 crisis and its uneven impacts add another layer to the complex inter-play of factors that shape spatial variations in the distribution of wealth and wellbeing, raising questions about the extent to which structural inequalities have been reflected in the geography of the outbreak; whether the crisis will reinforce existing territorial inequalities or produce new territorial inequalities; and how experiences of the pandemic will change people’s perceptions of spatial justice and injustice, and their attitudes towards solidarity and regional resilience.
In common with many research projects, the planned work programme for IMAJINE has been disrupted by restrictions on travel and fieldwork and the pressures on consortium members as we negotiate the challenge of balancing research with caring responsibilities, online teaching, contingency planning, volunteering and the emotional labour of surviving the crisis. However, like other social scientists, we have also started to reflect on how COVID-19 will change the society that we are studying, how the data we collect and findings we produce will be different after the outbreak than before. Additionally, we have been considering how our research and our expertise might help policy-makers and practitioners to understand the changing societal context, to manage the recovery, and to plan for future pandemics.
As such, we have identified a number of areas in which we can potentially make contributions from IMAJINE through minor modifications to our research and revisiting the analysis of collected data. This work will be done over the next 12 months as circumstances allow and we will be periodically producing short briefings that will be made available on the IMAJINE project website and through the EU’s Horizon Results Platform. In this two-part introductory blog-post, I want to briefly present an overview of the issues that we will be considering and discuss some initial analysis.
Data Challenges
Our concern is with variations in the impact of COVID-19 and associated control measures for sub-national regions and how these compare between countries, which immediately presents challenges of data availability, quality and comparability. There is an unprecedented volume of data being produced and released in close to real time by governments and public health agencies on COVID-19, however much of this sits on national or regional websites, with limited transnational collation. The authoritative Johns Hopkins University dashboard publishes detailed county- and state-level data for the USA, but only national data for most of the rest of the world. The excellent tracker site maintained by the Financial Times is one of the few outlets to recognize the importance of sub-national data, but has graphics for only selected regions.
In the United States, researchers have called for COVID-19 data to be released by Census tract or ZIP code, following a survey that highlighted variations in data between states. Similar disparities exist in Europe. Most European governments have created graphical dashboards with detailed data, including regional break-downs, but the spatial scale of the available data varies. Whilst some countries have published data on COVID-19 cases and mortalities disaggregated to individual municipalities, others only do so for large regions. Several states have not released data on COVID-19 mortalities below the national level.
Even where data is available, it is not necessarily comparable. Data on COVID-19 cases reflect differences in national testing policies as much as actual variations in infections. Mortality data are arguably more comparable, but are still affected by differences in reporting practices and time-lags, as well as variations in whether or not deaths outside hospitals are included. Then there is the challenge of collecting and analyzing data on a fast-evolving phenomenon, with spatial patterns shifting each day. For all these reasons, it is likely to be several weeks before a stable, rigorous analysis of sub-national spatial variations in the COVID-19 outbreak is possible, and it is unlikely to be comprehensive for the whole of Europe or indeed to document the full number of COVID-19 cases or deaths. For now, for an exploratory analysis of the data to scope provisional patterns and generate hypotheses, we have taken an arbitrary cross-section at the end of April, discussing in this post data collated from national official dashboards and daily reports on 1st May and analysed at the scale of NUTS 2 regions.
Spatial patterns of the COVID-19 outbreak
By the end of April 2020, the COVID-10 pandemic had spread to 187 countries and sovereign territories. This global reach, combined with the tendency of news media to report on the situation in different countries without emphasizing internal variations, obscures the extent to which the COVID-19 outbreak in many ways a significantly regionalized phenomenon. There are 22 regions in Europe with more than 1,000 COVID-19 related deaths confirmed, and a further 3 regions for which accurate data is not available, but where deaths are likely to exceed 1,000 given what we know about the geographical distribution of cases. These 25 regions together comprise just under a quarter of Europe’s population, but account for at least 53% of COVID-19 deaths in the continent. A further 28 regions with at least 500 COVID-related deaths (confirmed or projected) account for around a further 15% of mortalities in Europe.
Regions and cities in Europe with more than 500 COVID-19 related deaths (to end April 2020)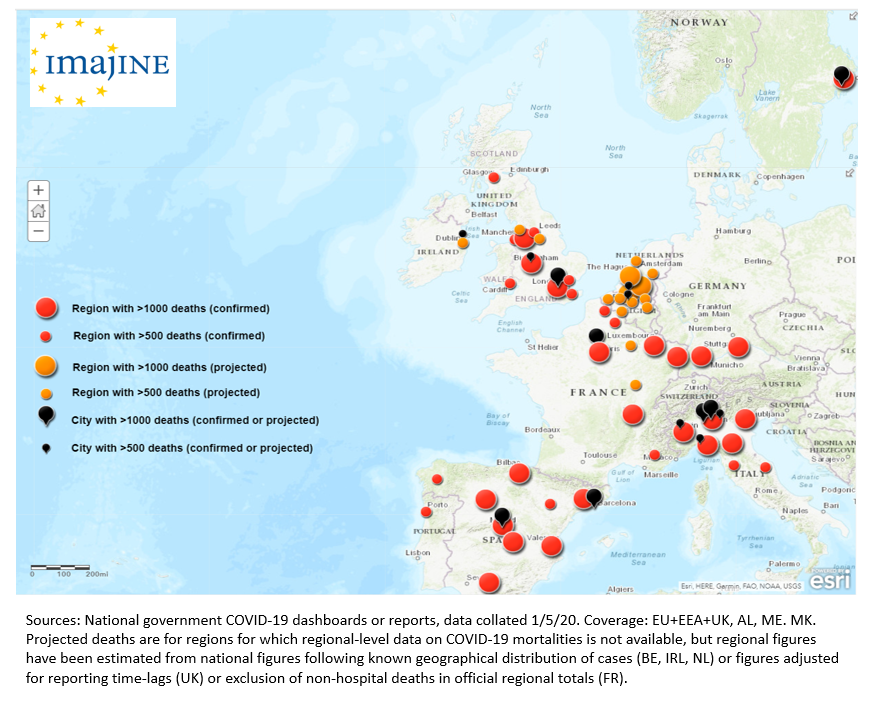
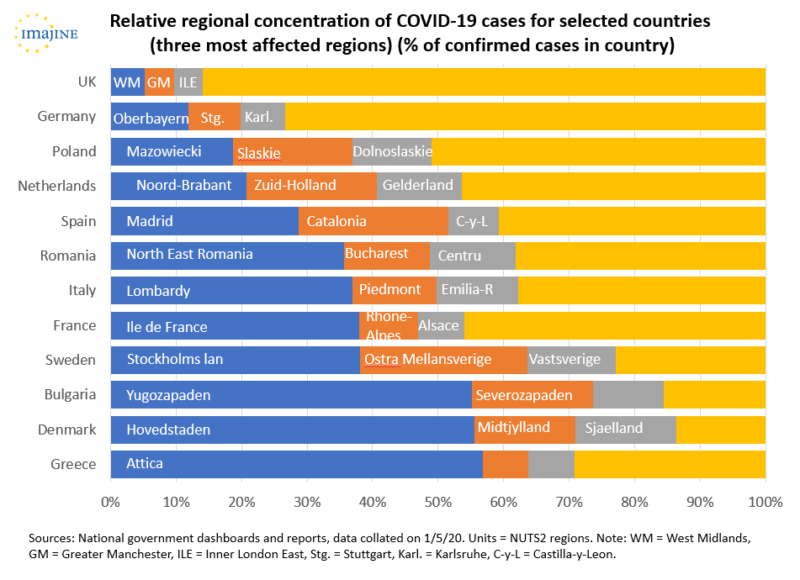
Even in countries with lower overall incidences of COVID-19, cases tend to be concentrated in certain regions. Thus, the Helsinki region accounts for 69% of confirmed cases in Finland, the Norte region (around Porto) 60% of cases in Portugal, the Oslo region 58% of cases in Norway, Attica 57% of cases in Greece, the Hovedstaden region around Copenhagen 56% of cases in Denmark, and the Yugozapaden region around Sofia 55% of cases in Bulgaria. By contrast, London has more COVID-19 cases than any other part of the UK, but only accounts for less than 17% of total cases in the UK. Indeed, there is some suggestion in the figures that countries with lower overall cases of COVID-19 have contained the virus more successfully in one or two concentrated areas, whereas the worst affected countries have less concentrated and multiple ‘hotspots’, which could in turn be connected with the timing and effectiveness of lockdown measures.
Neither is the concentration of COVID-19 cases just a reflection of the distribution of population. Although a number of ‘hotspots’ are focused on larger cities and populous regions, there are notable exceptions. Two-thirds of COVID-19 related deaths in Slovenia, for example, have occurred in three small municipalities – Ljutomer, Metlika and Smarje pri Jelsah – that have a combined population of fewer than 30,000 people. Some of the most significant concentrations of COVID-19 cases in Germany are in rural districts in Bavaria and Baden-Württemberg, and there are local concentrations of cases in rural municipalities in the southern Netherlands.
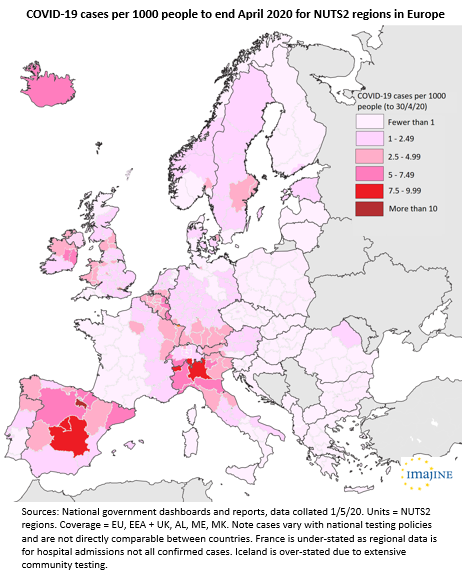
There are also significant variations in the number of cases of COVID-19 relative to population, with the highest ratios found in the worst affected regions of Italy and Spain (the patterns in the map below are distorted by differences in testing and reporting between countries – incidences in France are under-stated as the regional data is for hospital admissions not all confirmed cases, whereas Iceland stands out due to more extensive testing of the population). Another way of assessing these disparities is to compare the actual number of confirmed COVID-19 cases in a region with the number that would be expected if all cases in a country were distributed in proportion to population. On this measure, Lombardy has had over 41,000 more cases of COVID-19 than would be expected with a proportionate distribution, Madrid over 31,000 more cases, Catalonia over 14,000 more cases, the Oberbayern region of Bavaria over 10,000 more cases, and the Lac Leman region of Switzerland over 6,500 more cases. Conversely, Antwerp, Berlin, Bristol, Lisbon, Naples, Rome and Zurich, and regions including Andalusia, Brittany and Sicily, have experienced substantially fewer cases than projected with a proportionate distribution within their respective countries.
The geographically uneven impact fits with what we know about the epidemiological character of the SARS-CoV-2 coronavirus: that it spreads in clusters, with a high degree of contagion between people in close proximity with each other. In several of the worst affected regions, specific events have been suggested as catalysts for the explosion of the outbreak in the locality – some supported by evidence, others more tentative. The coincidence of the global intensification of the outbreak with the start of Lent in the Christian calendar and carnival season has been proposed as a factor in higher incidences in Catholic districts of Belgium, Germany and the Netherlands than in Protestant districts (as well as the emergence of New Orleans as an early epicentre of the outbreak in the United States). Similarly, coincidence with Purim and challenges of communication with ultra-Orthodox communities have been connected with a disproportionately high number of cases in parts of North London with relatively large Jewish populations. An evangelical prayer conference in Mulhouse has been identified as a cause of the severe outbreak in Haut-Rhin department in France, whilst more secular forms of devotion have also been fingered, with suggestions that Champions League matches in Liverpool and Milan contributed to concentrations of cases in Merseyside and Lombardy, and leaked local data showing higher hospital admissions in Cheltenham, England, compared with neighbouring districts used to question a controversial decision to proceed with a horse-racing festival in the town in mid March. In Spain, there are theories that a rally for International Women’s Day intensified the outbreak in Madrid, and that a well-attended funeral in Vittoria-Gastiez helped to spread the virus in the Basque Country and neighbouring La Rioja.
Explanations such as these are important for understanding the evolution of the pandemic and justify restrictions on travel and public gatherings. However, they also embellish the capricious nature of the coronavirus and feed narratives promoted by some politicians and commentators that present COVID-19 as a social leveller, a disease that anyone can catch, with concentrations in particular places or social groups a matter of bad luck. The danger of this narrative is that it plays down the role that established socio-economic and territorial inequalities may have in the geography of the outbreak, making some communities more exposed and vulnerable than others.
Territorial inequalities and the COVID-19 outbreak
It is well known that geographical variations in health reflect socio-economic inequalities between territories. There is little reason to think that COVID-19 would be different. At first sight, however, the relationship between the pattern of COVID-19 cases and territorial socio-economic inequalities appears to be the inverse of what might normally be expected. Many of the most severely affected regions are among the most prosperous parts of their countries: Baden-Württemberg, Bavaria, Catalonia, Ile de France, Lombardy, London. A simple scatterplot appears to support this observation, with a modest but clear trendline showing increasing number of cases of COVID-19 relative to population with increasing GDP per capita (with the worst affected regions of Italy and Spain as prominent outliers).
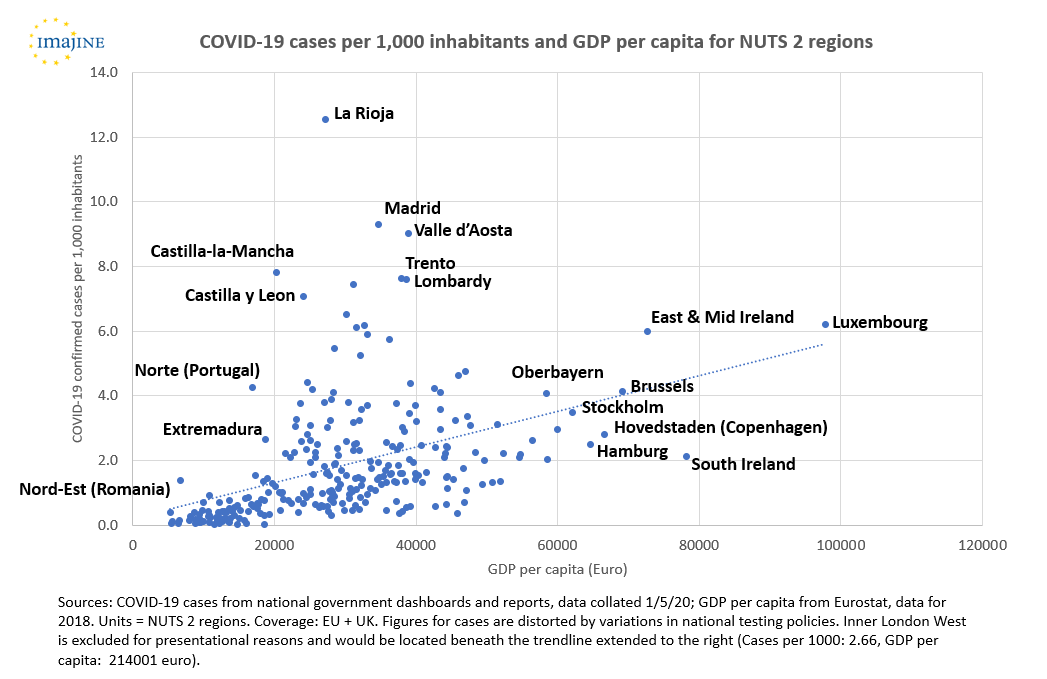
This basic analysis does not demonstrate causality, but it is not difficult to hypothesize why COVID-19 hotspots might be associated with more prosperous regions. More prosperous regions tend to have more intensive connections with other parts of the world – more people travelling for business to other prosperous regions, or to emerging markets in east Asia, and more people able to afford winter sports holidays. More prosperous regions often have greater public transport use, and a preponderance of working environments that are conducive to virus transmission – more people working in open-plan offices, queueing for lunch at cafes and sandwich bars, and in jobs involving frequent meetings with a range of different people.
The significance of connectivity, rather than prosperity per se, is supported by a belt of higher COVID-19 incidence running through ski-ing areas of Alps. These include the Landeck district in Tirol, which has the highest relative incidence of COVID-19 in Austria with over 22 confirmed cases per 1,000 population, and which is the location of the ski resort of Ischgl where more than 1,800 people are believed to have become infected before travelling home to countries across Europe.
Other localized examples hint at the role of migrant labour networks. A severe outbreak in Suceava county in Romania, for instance, has been traced to a migrant worker returning from northern Italy (though it should be noted that migrant workers returning to other parts of Romania have not triggered clusters on the same scale as Suceava, where the situation is alleged to have been compounded by poor local management). Outside Europe, flows of migrant labour with Spain have been linked with the devasting COVID-19 explosion in Ecuador’s largest city, Guayaquil. If verified, transfer through migrant labour mobility would highlight a specific function of territorial inequality in the spread of COVID-19: the transformation of inter-dependencies that exploit territorial inequalities into vectors of coronavirus transmission from affluent regions into less developed regions that are less well equipped to cope with the consequences.
The association of COVID-19 with more prosperous regions is further disrupted by deeper analysis that emphasizes two important qualifications. First, the geography of COVID-19 fatalities differs subtly from that of COVID-19 cases, with evidence of higher mortality rates in less affluent areas. Second, within prosperous regions with high incidence of COVID-19 there are disparities in both cases and deaths, with certain social groups and localities more affected than others.
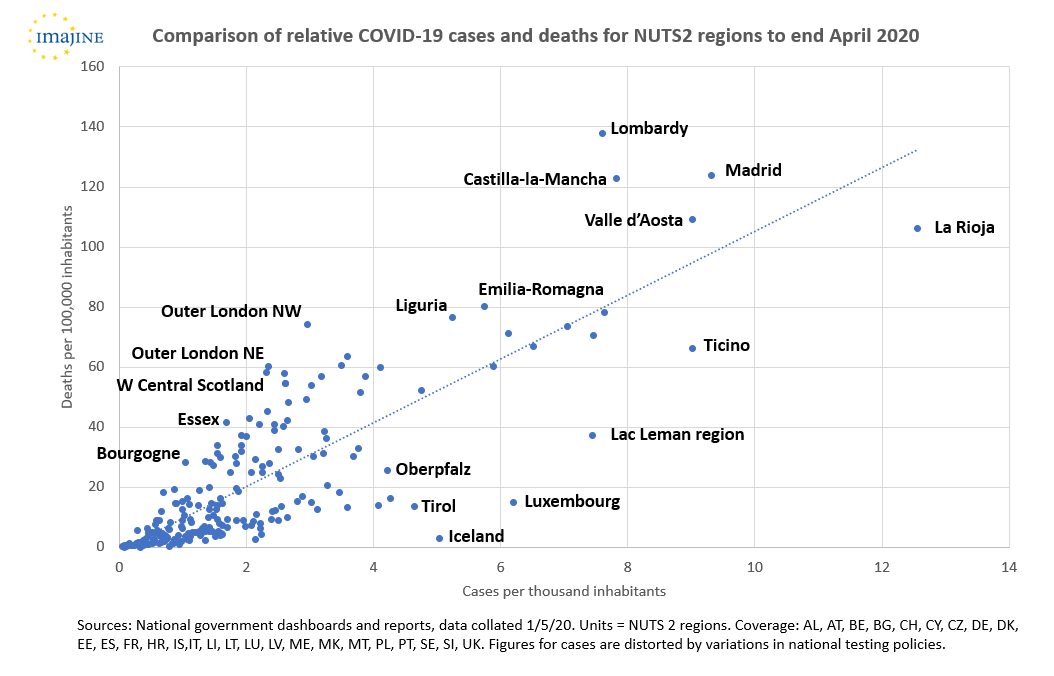
Analysis of the relationship between COVID-19 mortalities and territorial inequalities is hampered by substantial noise in the data. Unsurprisingly, COVID-19 mortalities are strongly correlated with COVID-19 cases, such that those regions with the highest confirmed cases relative to population also have the highest mortality rates, regardless of their socio-economic profile. Outliers to this trend potentially point to the influence of territorial inequalities, with for example relatively affluent regions including Ticino, Tirol, Luxembourg and the Lac Leman region of Switzerland all reporting fewer deaths relative to confirmed cases than projected by the trendline (although for the Austrian and Swiss cases this could also reflect transmissions in ski resorts to younger, generally healthy individuals with better chances of recovery). A number of British regions stand out as outliers above the line, but this may reflect differences in testing policy rather than socio-economic inequalities.
Clearer patterns become evident where analysis is possible with sub-regional data. Analysis for Census Lower Super Output Areas (typically around 1,500 people) in England by the Office for National Statistics, using death rates standardized for age profiles, has revealed large differences in the impact of COVID-19 that map on to socio-economic inequalities – with an equivalent rate of 55.1 deaths per 100,000 people in the 10% most deprived areas compared with 25.3 deaths per 100,000 people in the 10% least deprived areas. Within London, the ONS analysis shows the proportion of deaths between 1st March and 17th April attributed to COVID-19 ranging from none in several areas, mostly (though not all) in outer suburbs, to over 85% in seven more deprived inner-city neighbourhoods. District (Landkreise) level data in Germany also shows significant variations in local mortality rates, including relatively higher rates of deaths per 100,000 population in parts of the industrial Ruhr region and in districts of eastern Germany that otherwise have fairly low numbers of COVID-19 cases.
There are a number of factors that might contribute to the higher mortalities in more deprived areas, and research will be needed over coming months and years that interrogates these relationships thoroughly, including connections between poverty and underlying health conditions, the legacies of industrial diseases, more limited access to healthcare, and the demographic and occupational profiles of communities. In any given region, some people will be at greater risk from COVID-19 than others, as powerfully articulated in a noted monologue by BBC news anchor Emily Maitlis. Reports in the United States have highlighted the starkly greater mortality of Black Americans from COVID-19, with tentative explanations focusing on the greater incidence of Black Americans living in poverty and associated issues of ill-health, lack of health insurance, and precarious employment. The New York Times has moreover referred to the ‘white collar quarantine’, noting that whilst most employees in professional occupations can easily isolate and work from home, many blue collar workers do not have the option, either due to the absence of financial safety-nets, or because of their occupations – including as ‘key workers’ in sectors including health and social care, transport, food processing, cleaning and waste management and food retailing – with more risk of exposure to the coronavirus.
Such disparities in COVID-19 cases and mortalities between social cohorts have a geographical footprint with the residential clustering of social classes and ethnicities, which may in turn be compounded by the environments in which people live. Lower-income neighbourhoods tend to have higher population densities, less access to green space, and greater air pollution – all potentially aggravating factors. Moreover, communities that suffer disproportionately high mortality rates from COVID-19 will be weakened not only in economic capital but in social capital, and will require targeted support to rebuild economies and social infrastructure and to overcome emotional trauma – underlining the importance of local scale data on the COVID-19 outbreak.
In these ways, understanding and responding to the COVID-19 crisis raises questions of spatial justice, which will be discussed in the second part of this blog post.
Michael Woods (Aberystwyth University)
This research has received funding from the European Union’s Horizon 2020 research and innovation programme under grant agreement No 726950. This blog post reflects only the author’s view. The Commission is not responsible for any use that may be made of the information it contains.